A Look at Police-Related Deaths by Jurisdiction and Type of Force Used

For some people, information on police-involved deaths can be emotionally challenging to read. If you’d like to connect to our support and resource page, click here.
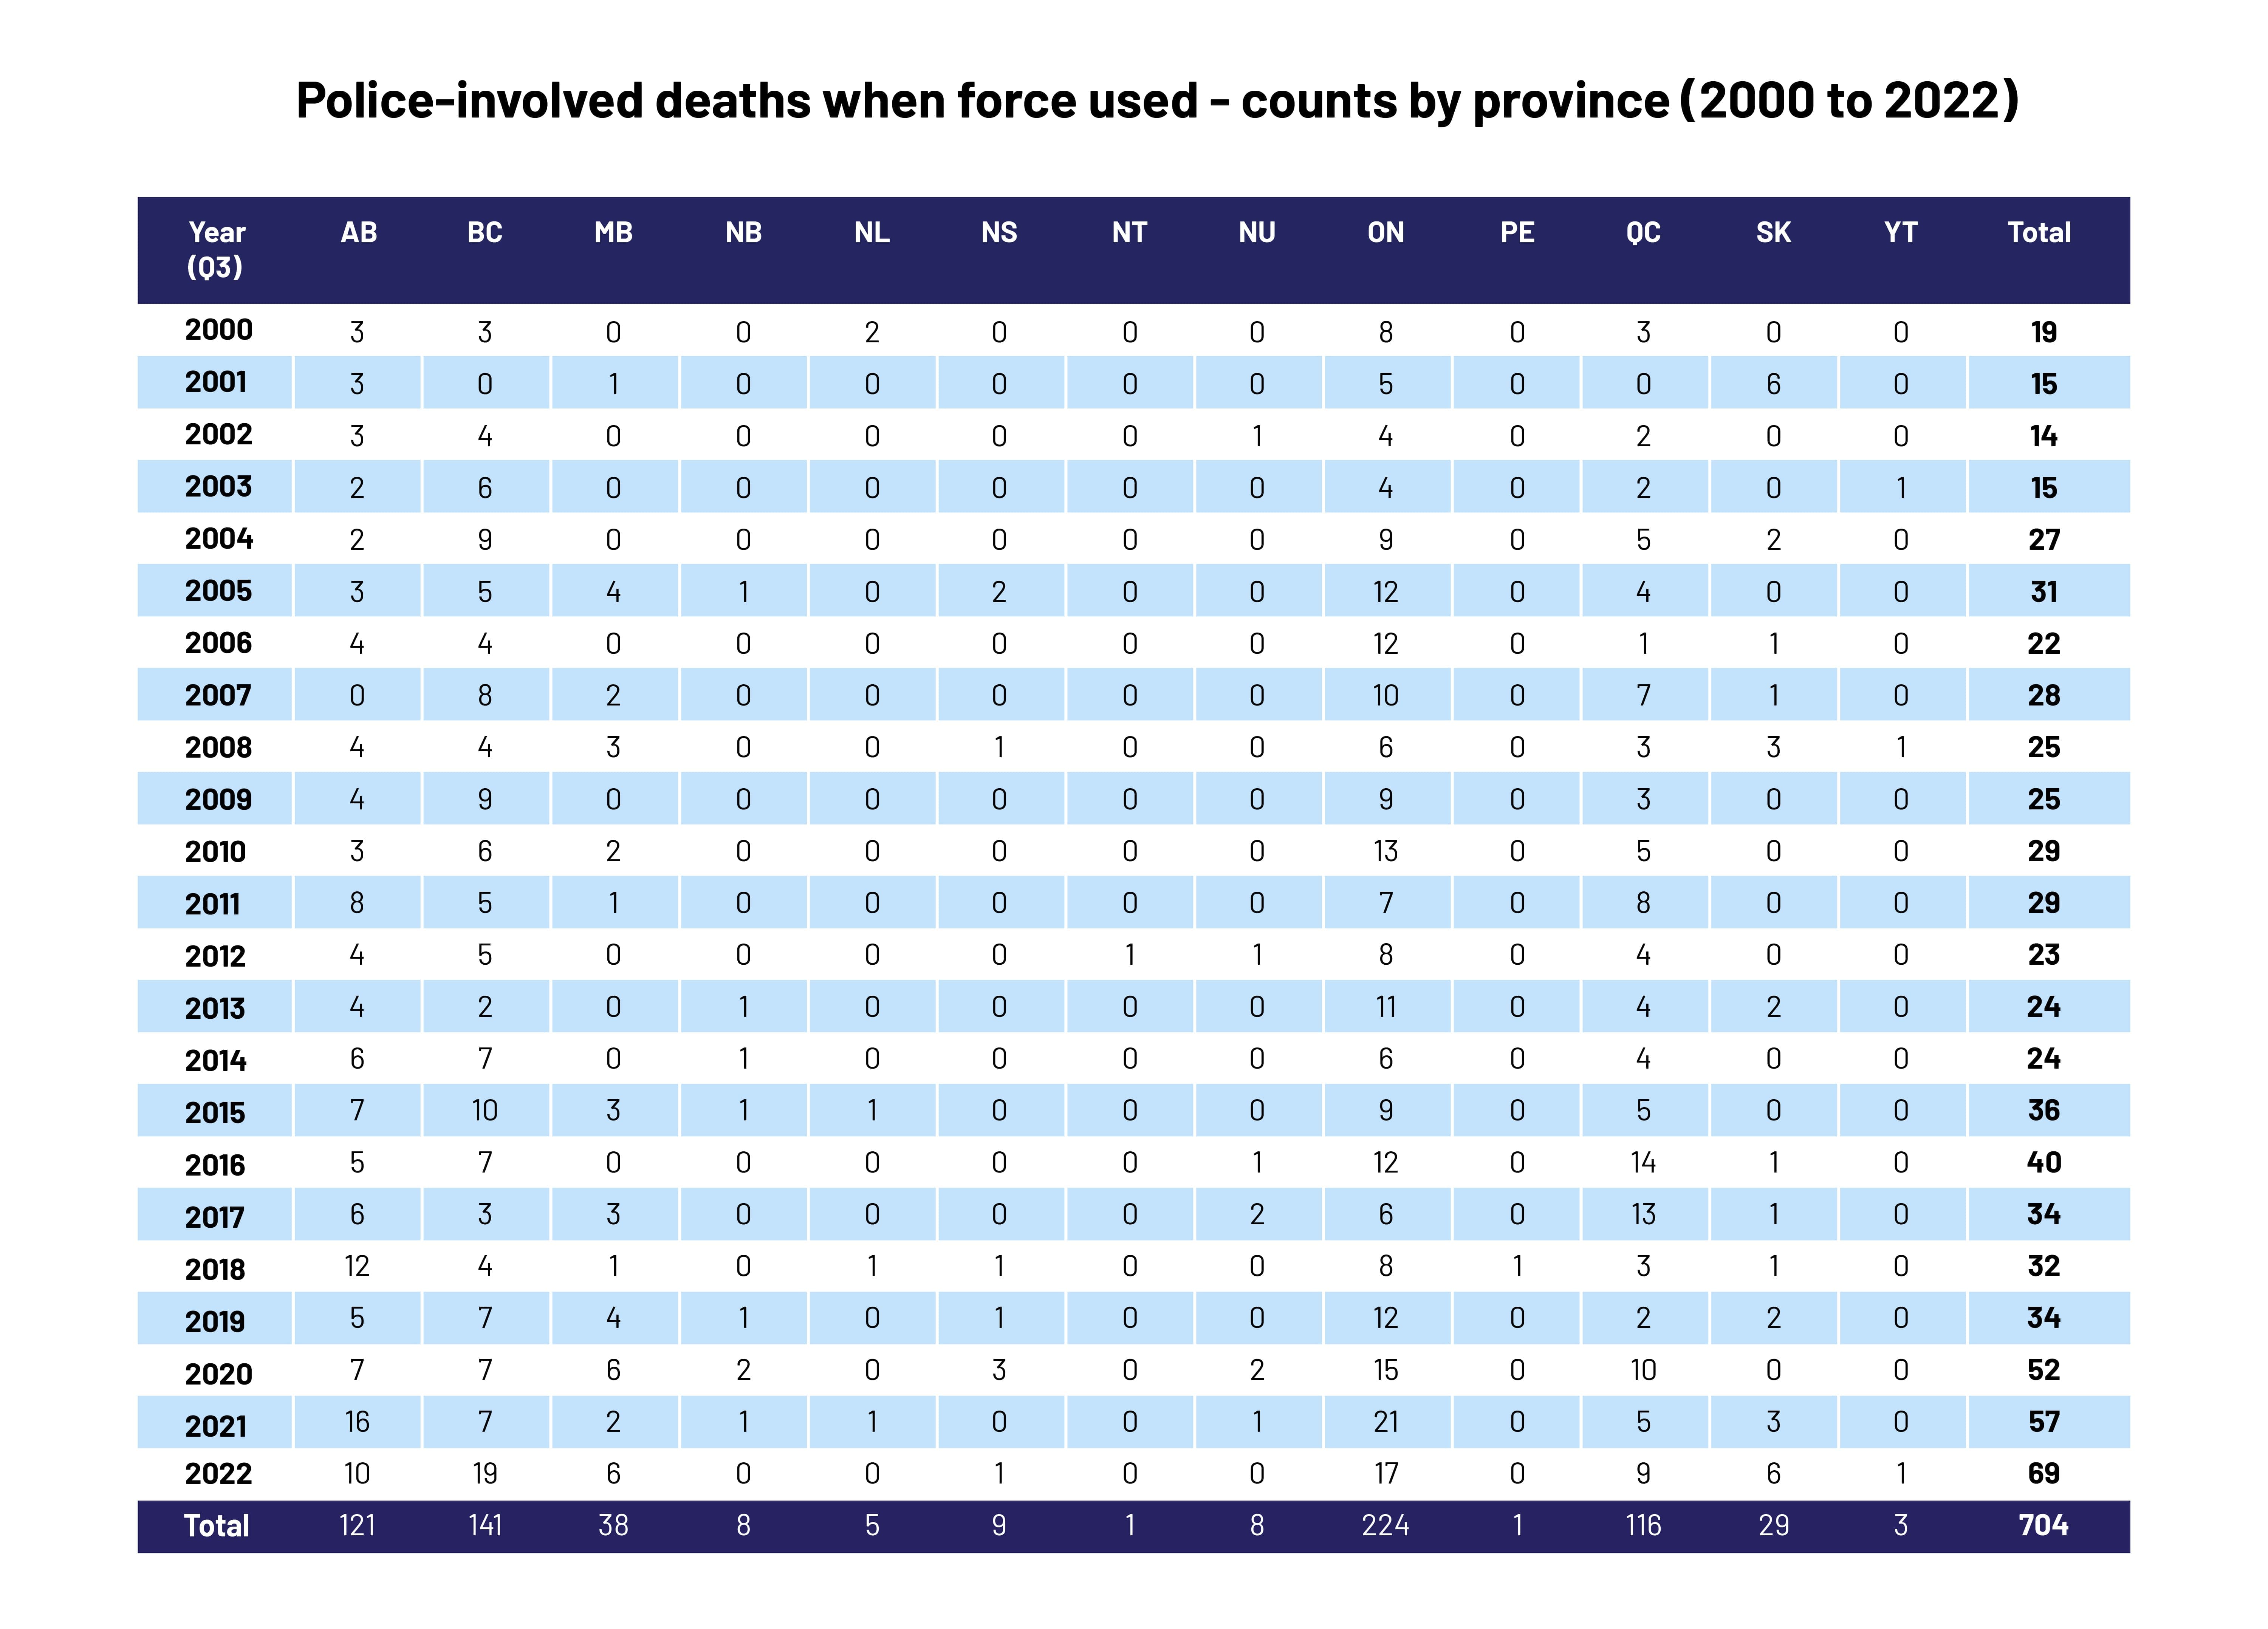
Our initial data currently covers deaths that followed from any intentional police use of force, from 2000 to the present day. This means that the data includes deaths from police shootings and instances where a person died after being subjected to other types of police weapons (e.g., guns, tasers, batons) or physical interventions (e.g., punches, kicks, physical holds).
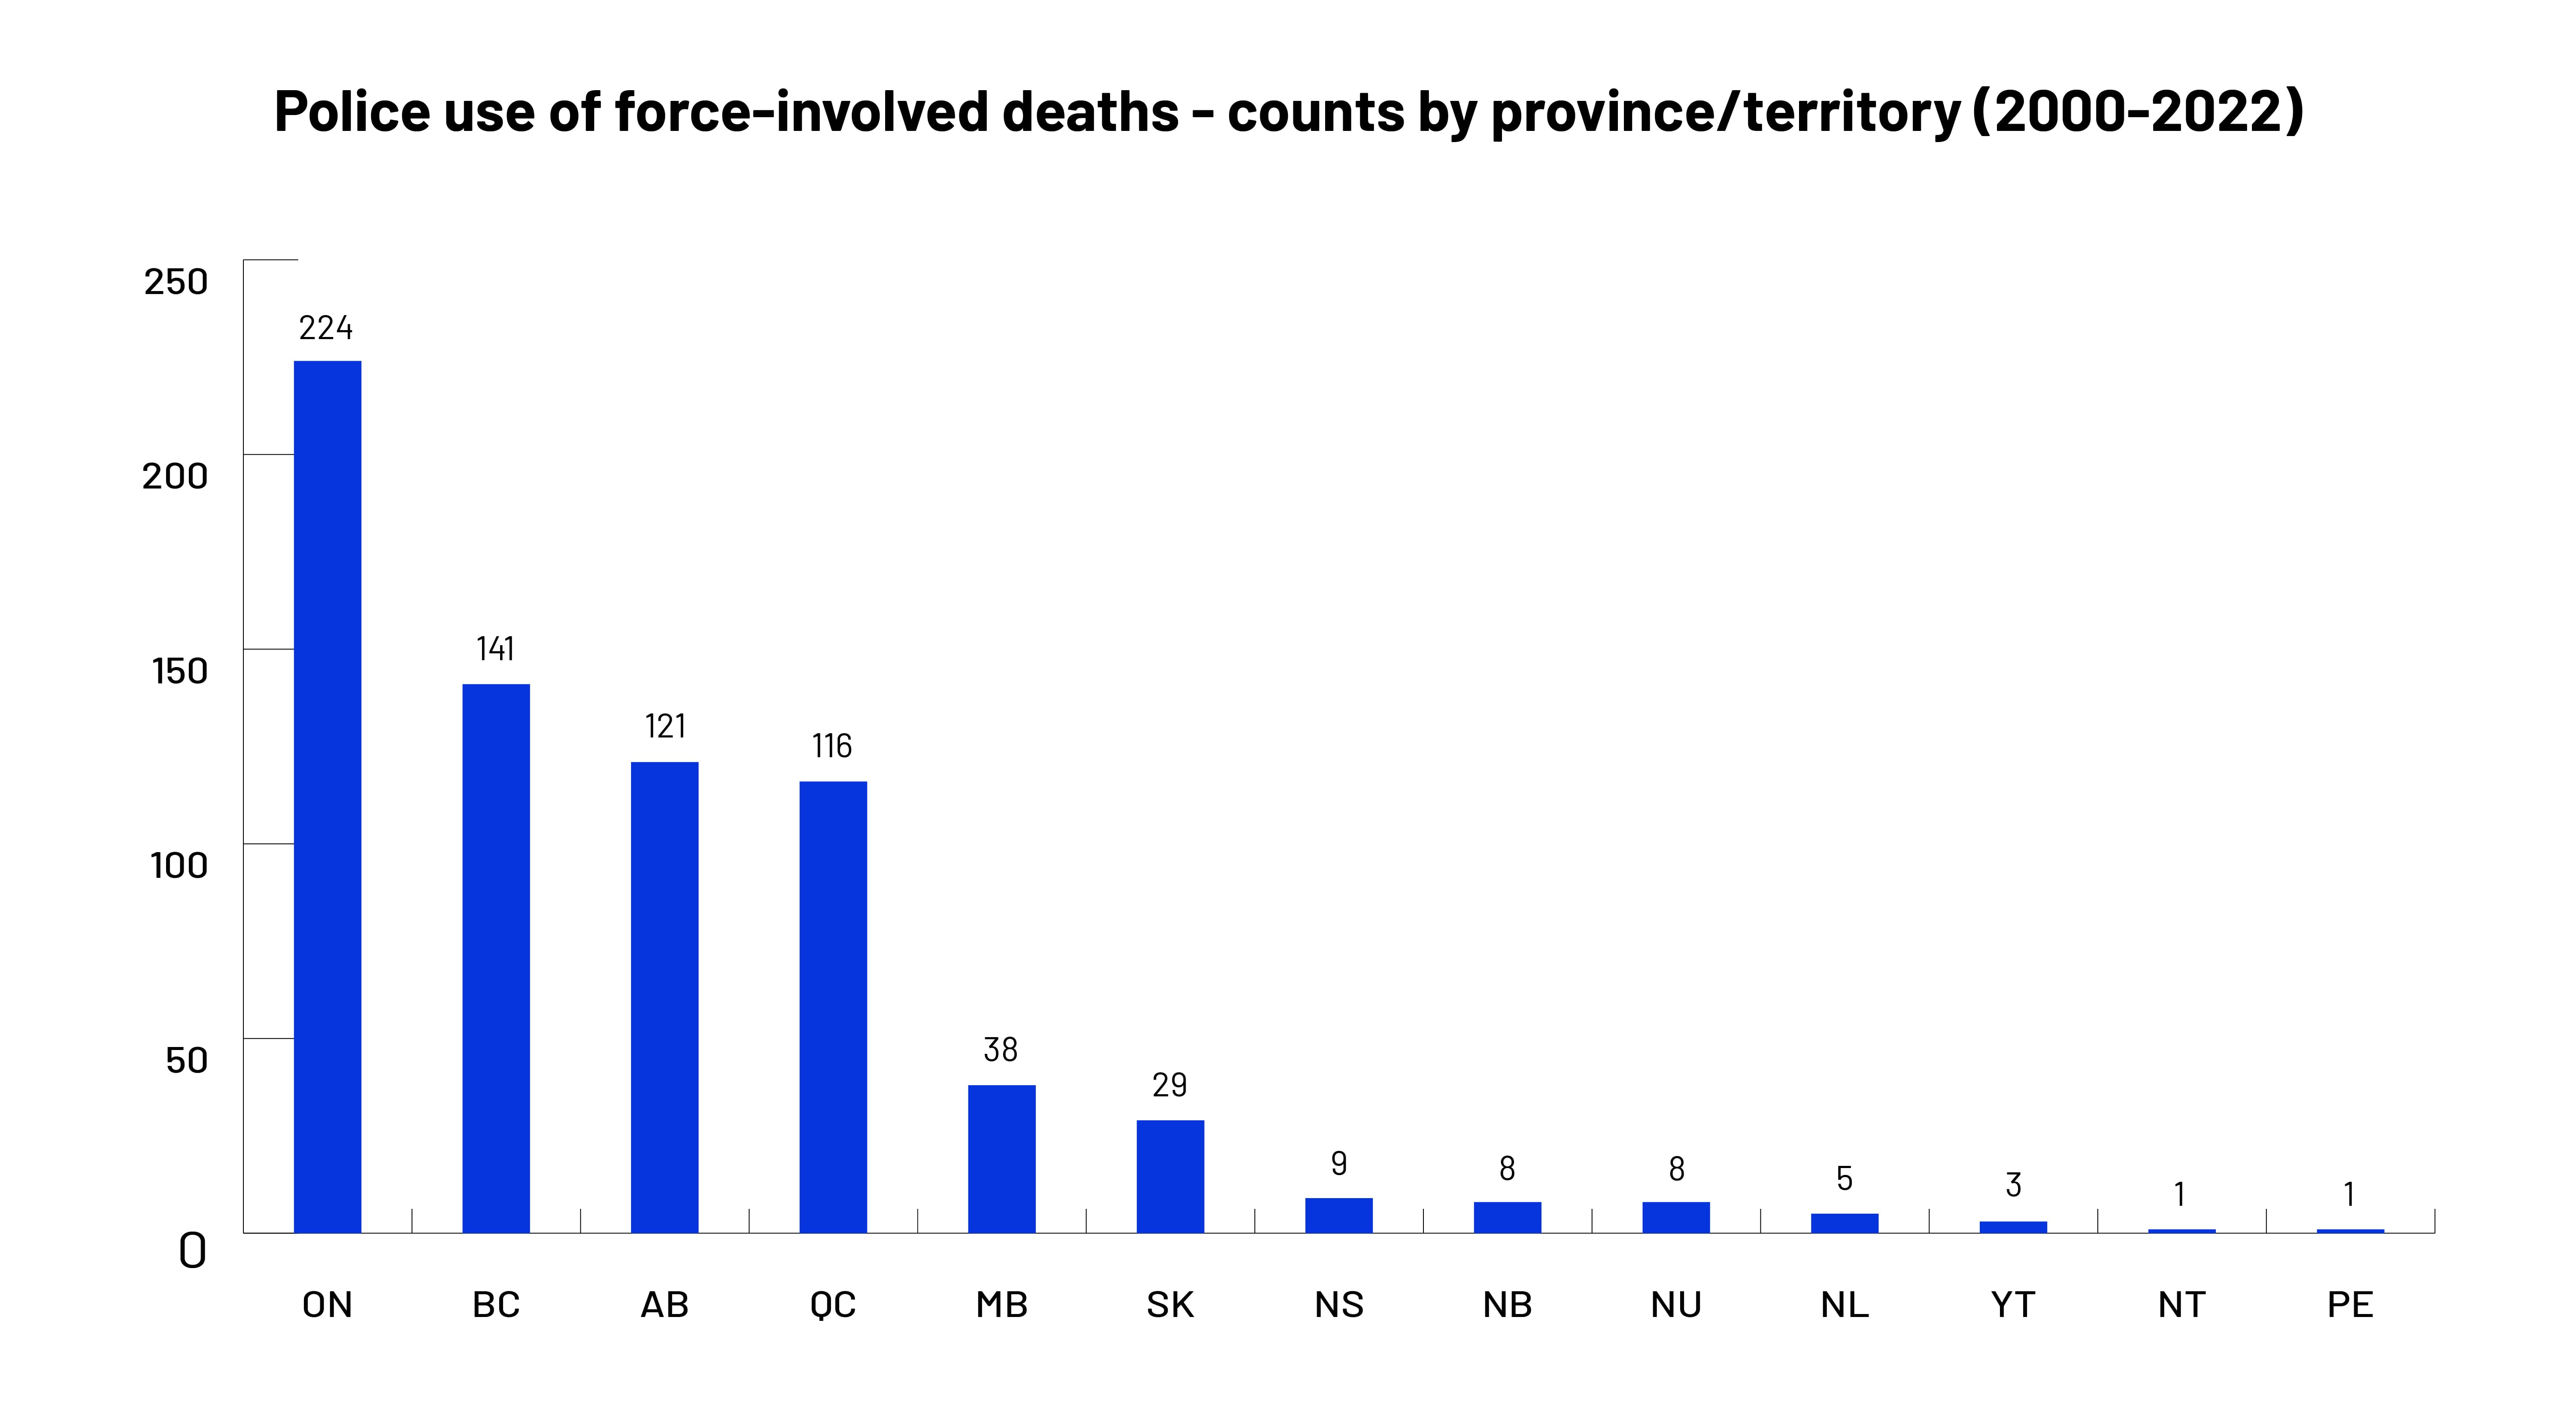
There are also stark differences between the numbers across different provinces and territories. By comparison, the total number of police use of force-related deaths by province and territory.
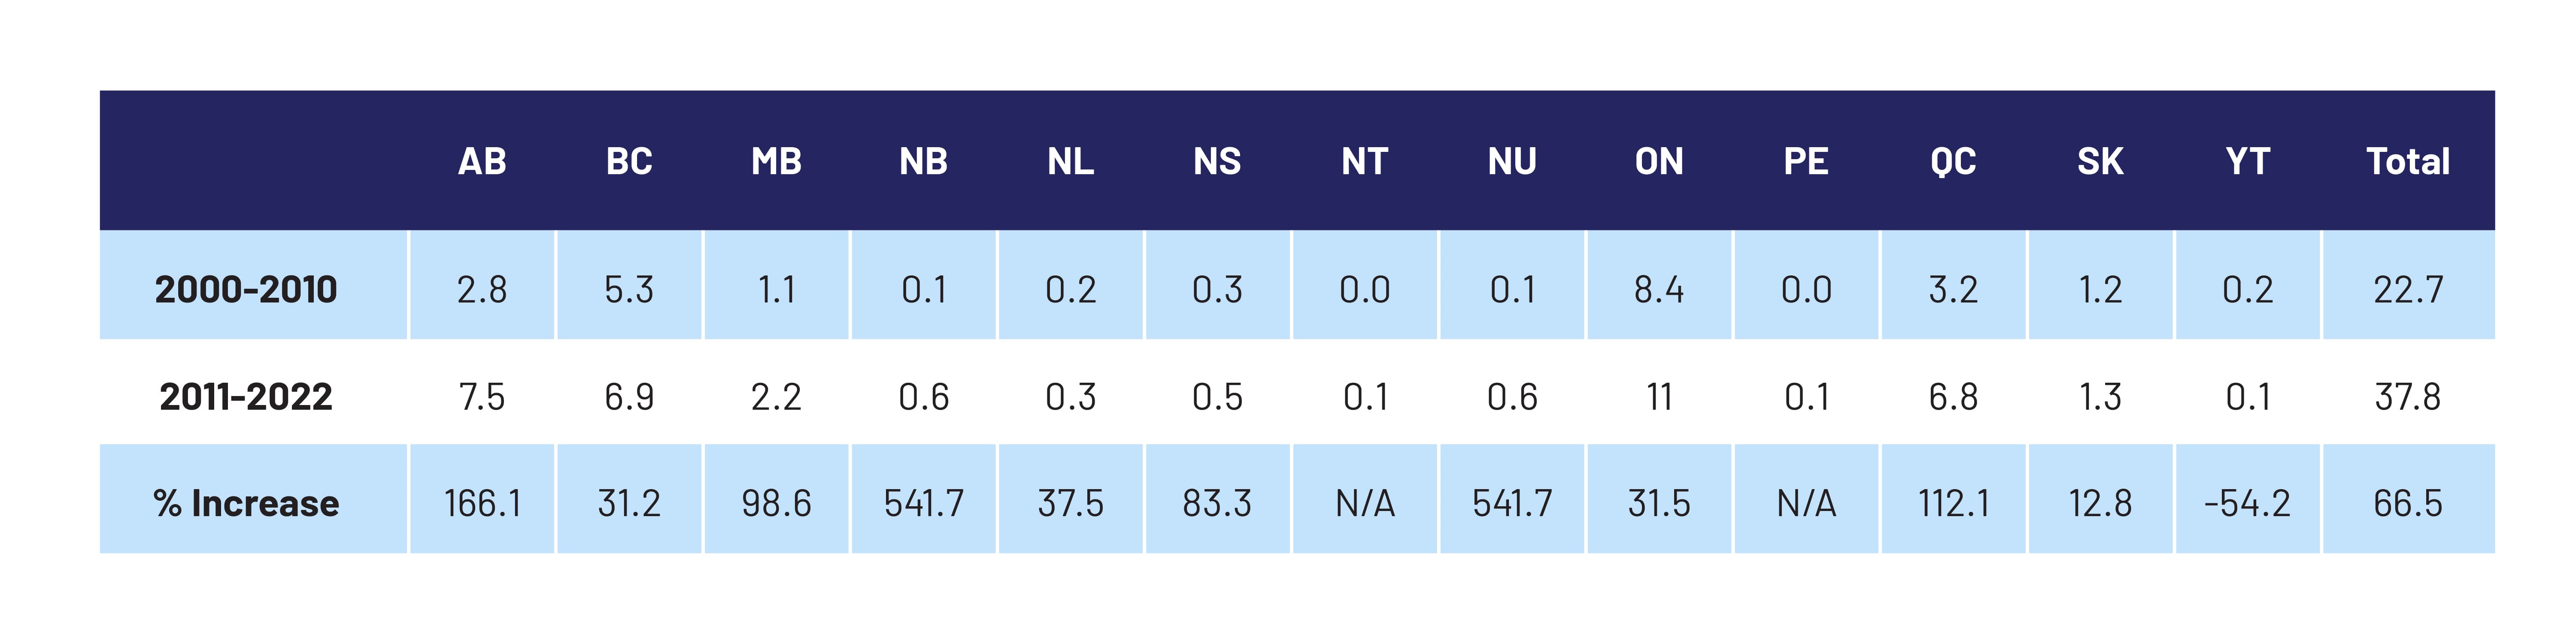
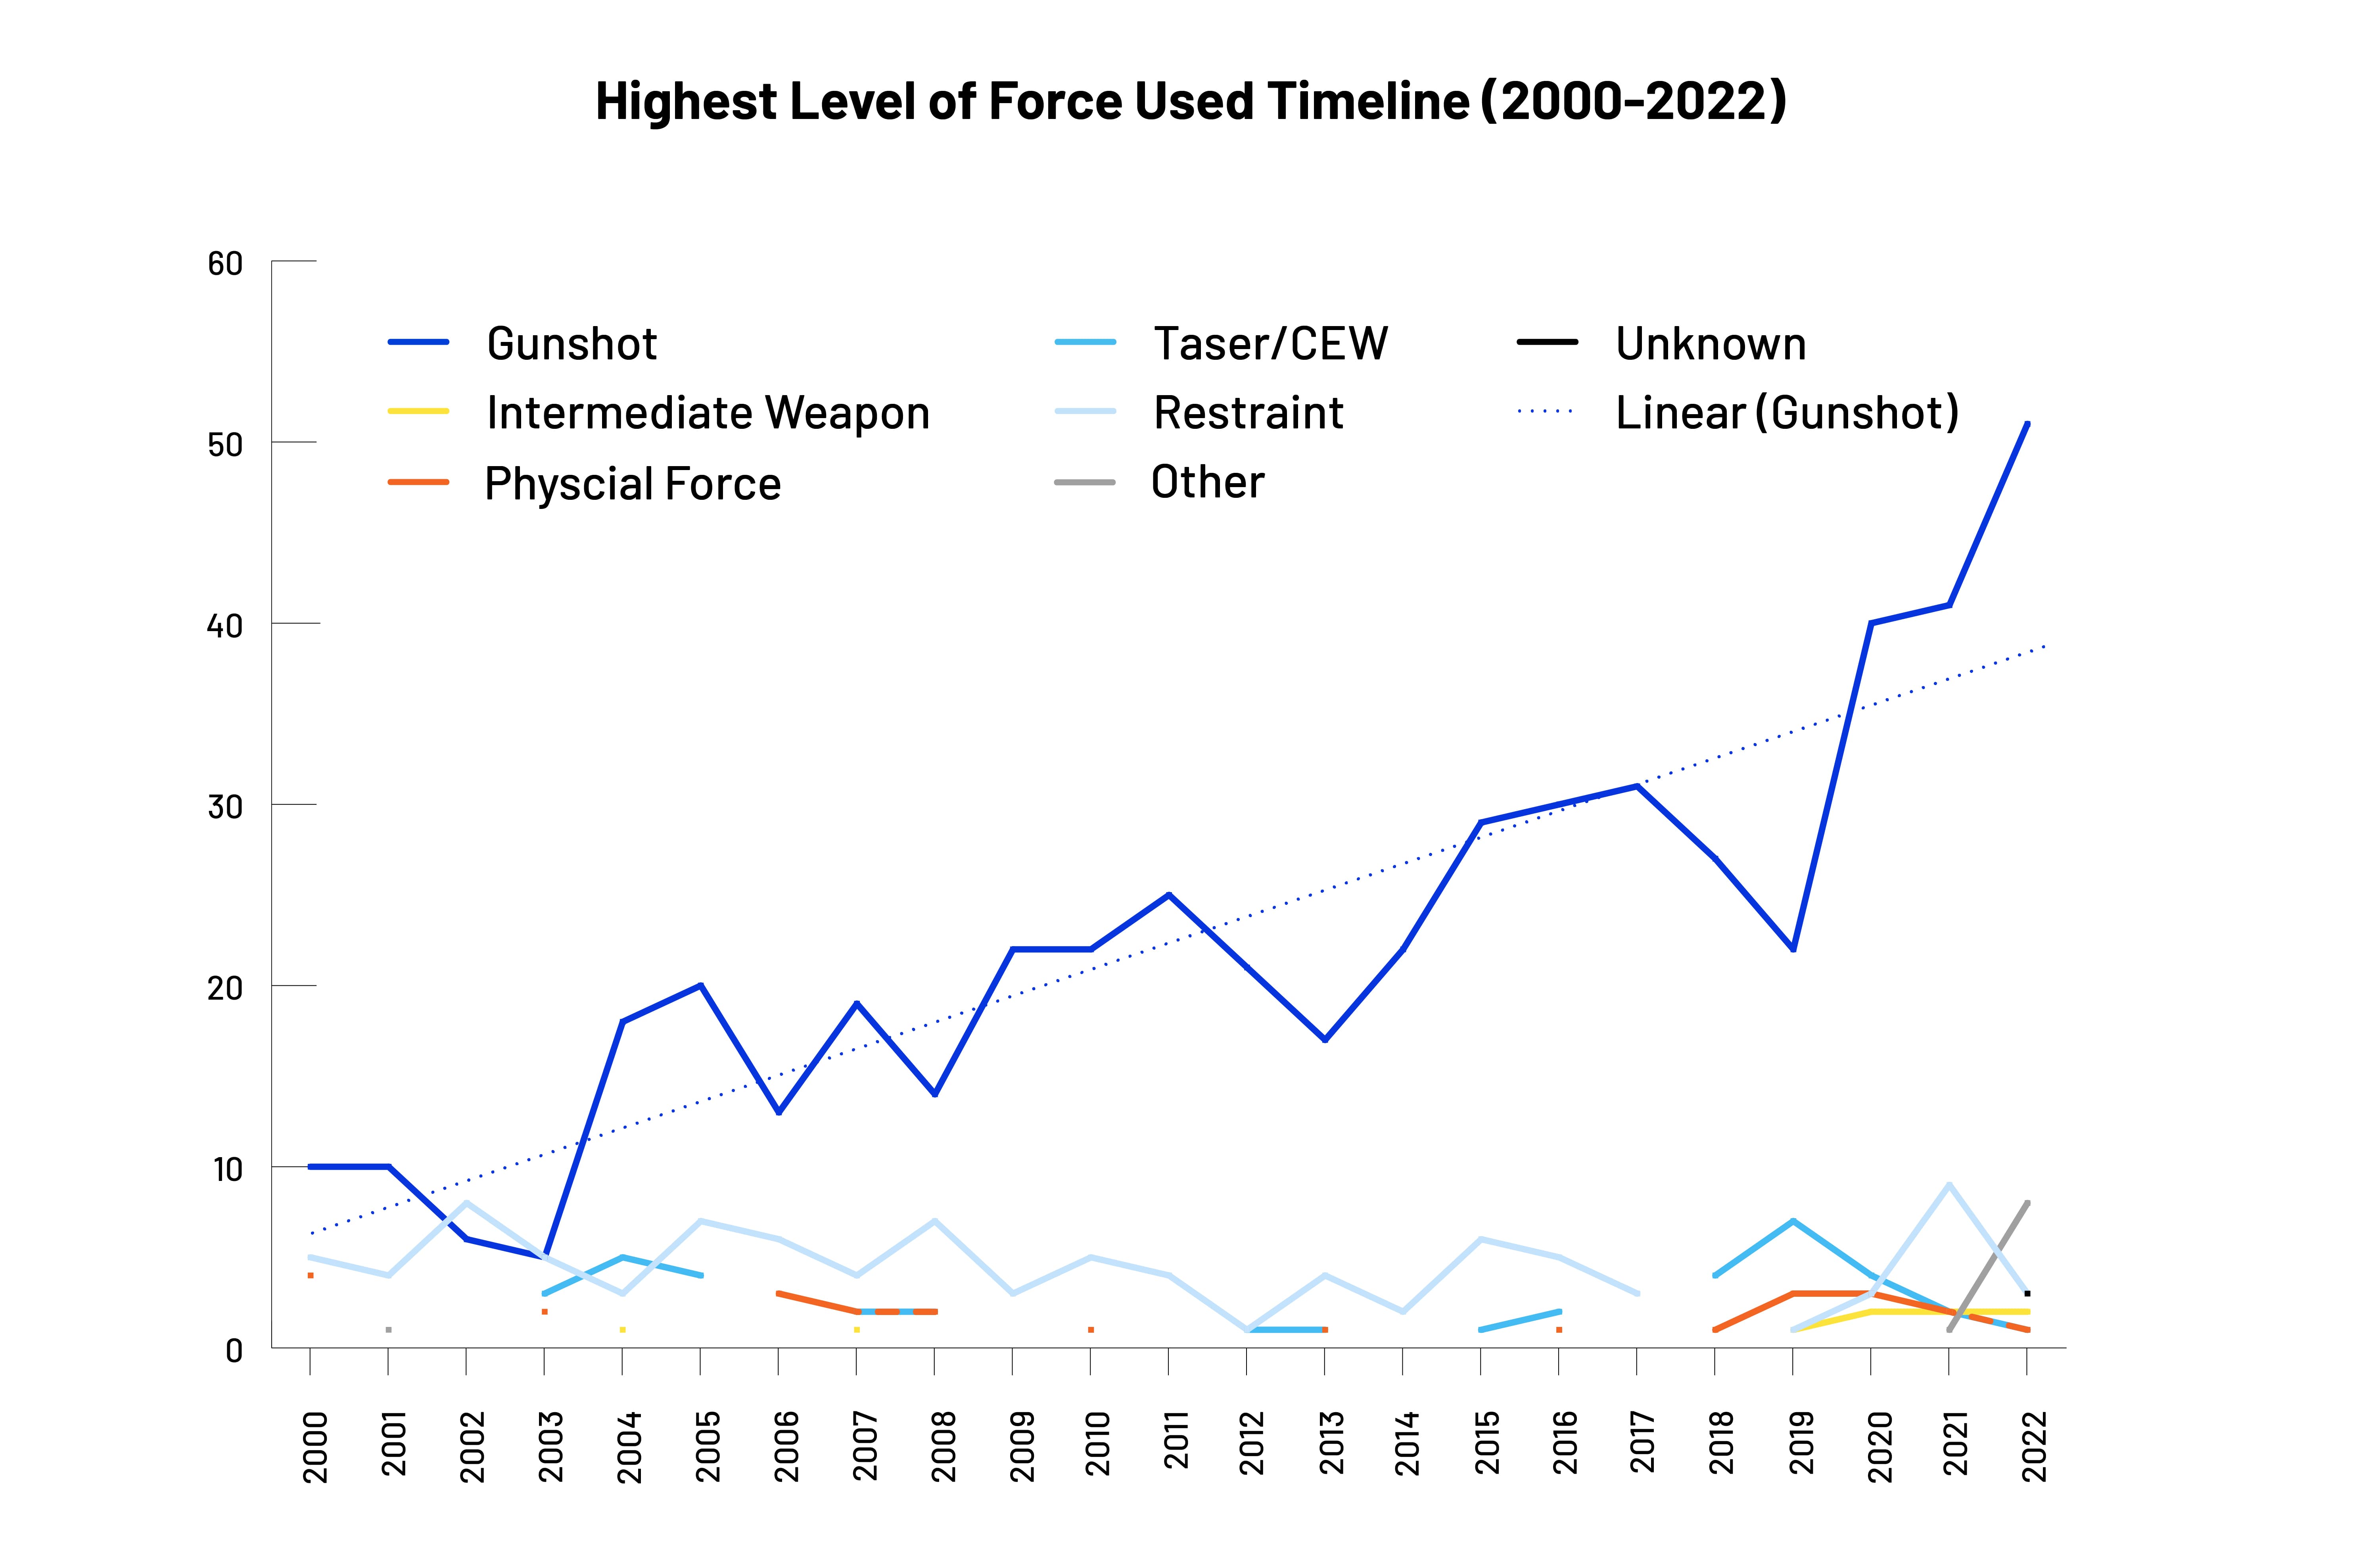
In most jurisdictions across Canada, the number of police-involved use of force deaths has increased over the past 22 years. Only the Yukon Territories have experienced a decrease in the average annual number of deadly force cases when comparing average counts between 2000-2010 and 2011-2022. While some jurisdictions have seen modest increases since 2010, most provinces and territories have seen increases by 30 percent or higher. New Brunswick and Nunavut each experienced an increase since 2010 with one death between 2000 and 2010 and seven deaths between 2011 and 2022. Other notables include Alberta’s increase of 2.8 deaths per year in 2000-2010 to 7.5 deaths per year from 2011-2022, and Quebec’s increase of 3.2 deaths per year in 2000-2010 to 6.8 between 2011-2022. The average difference from 2000 to 2010 and 2011 to 2022 is 66.5 percent. See a detailed annual breakdown by province/territory at the end of this post.
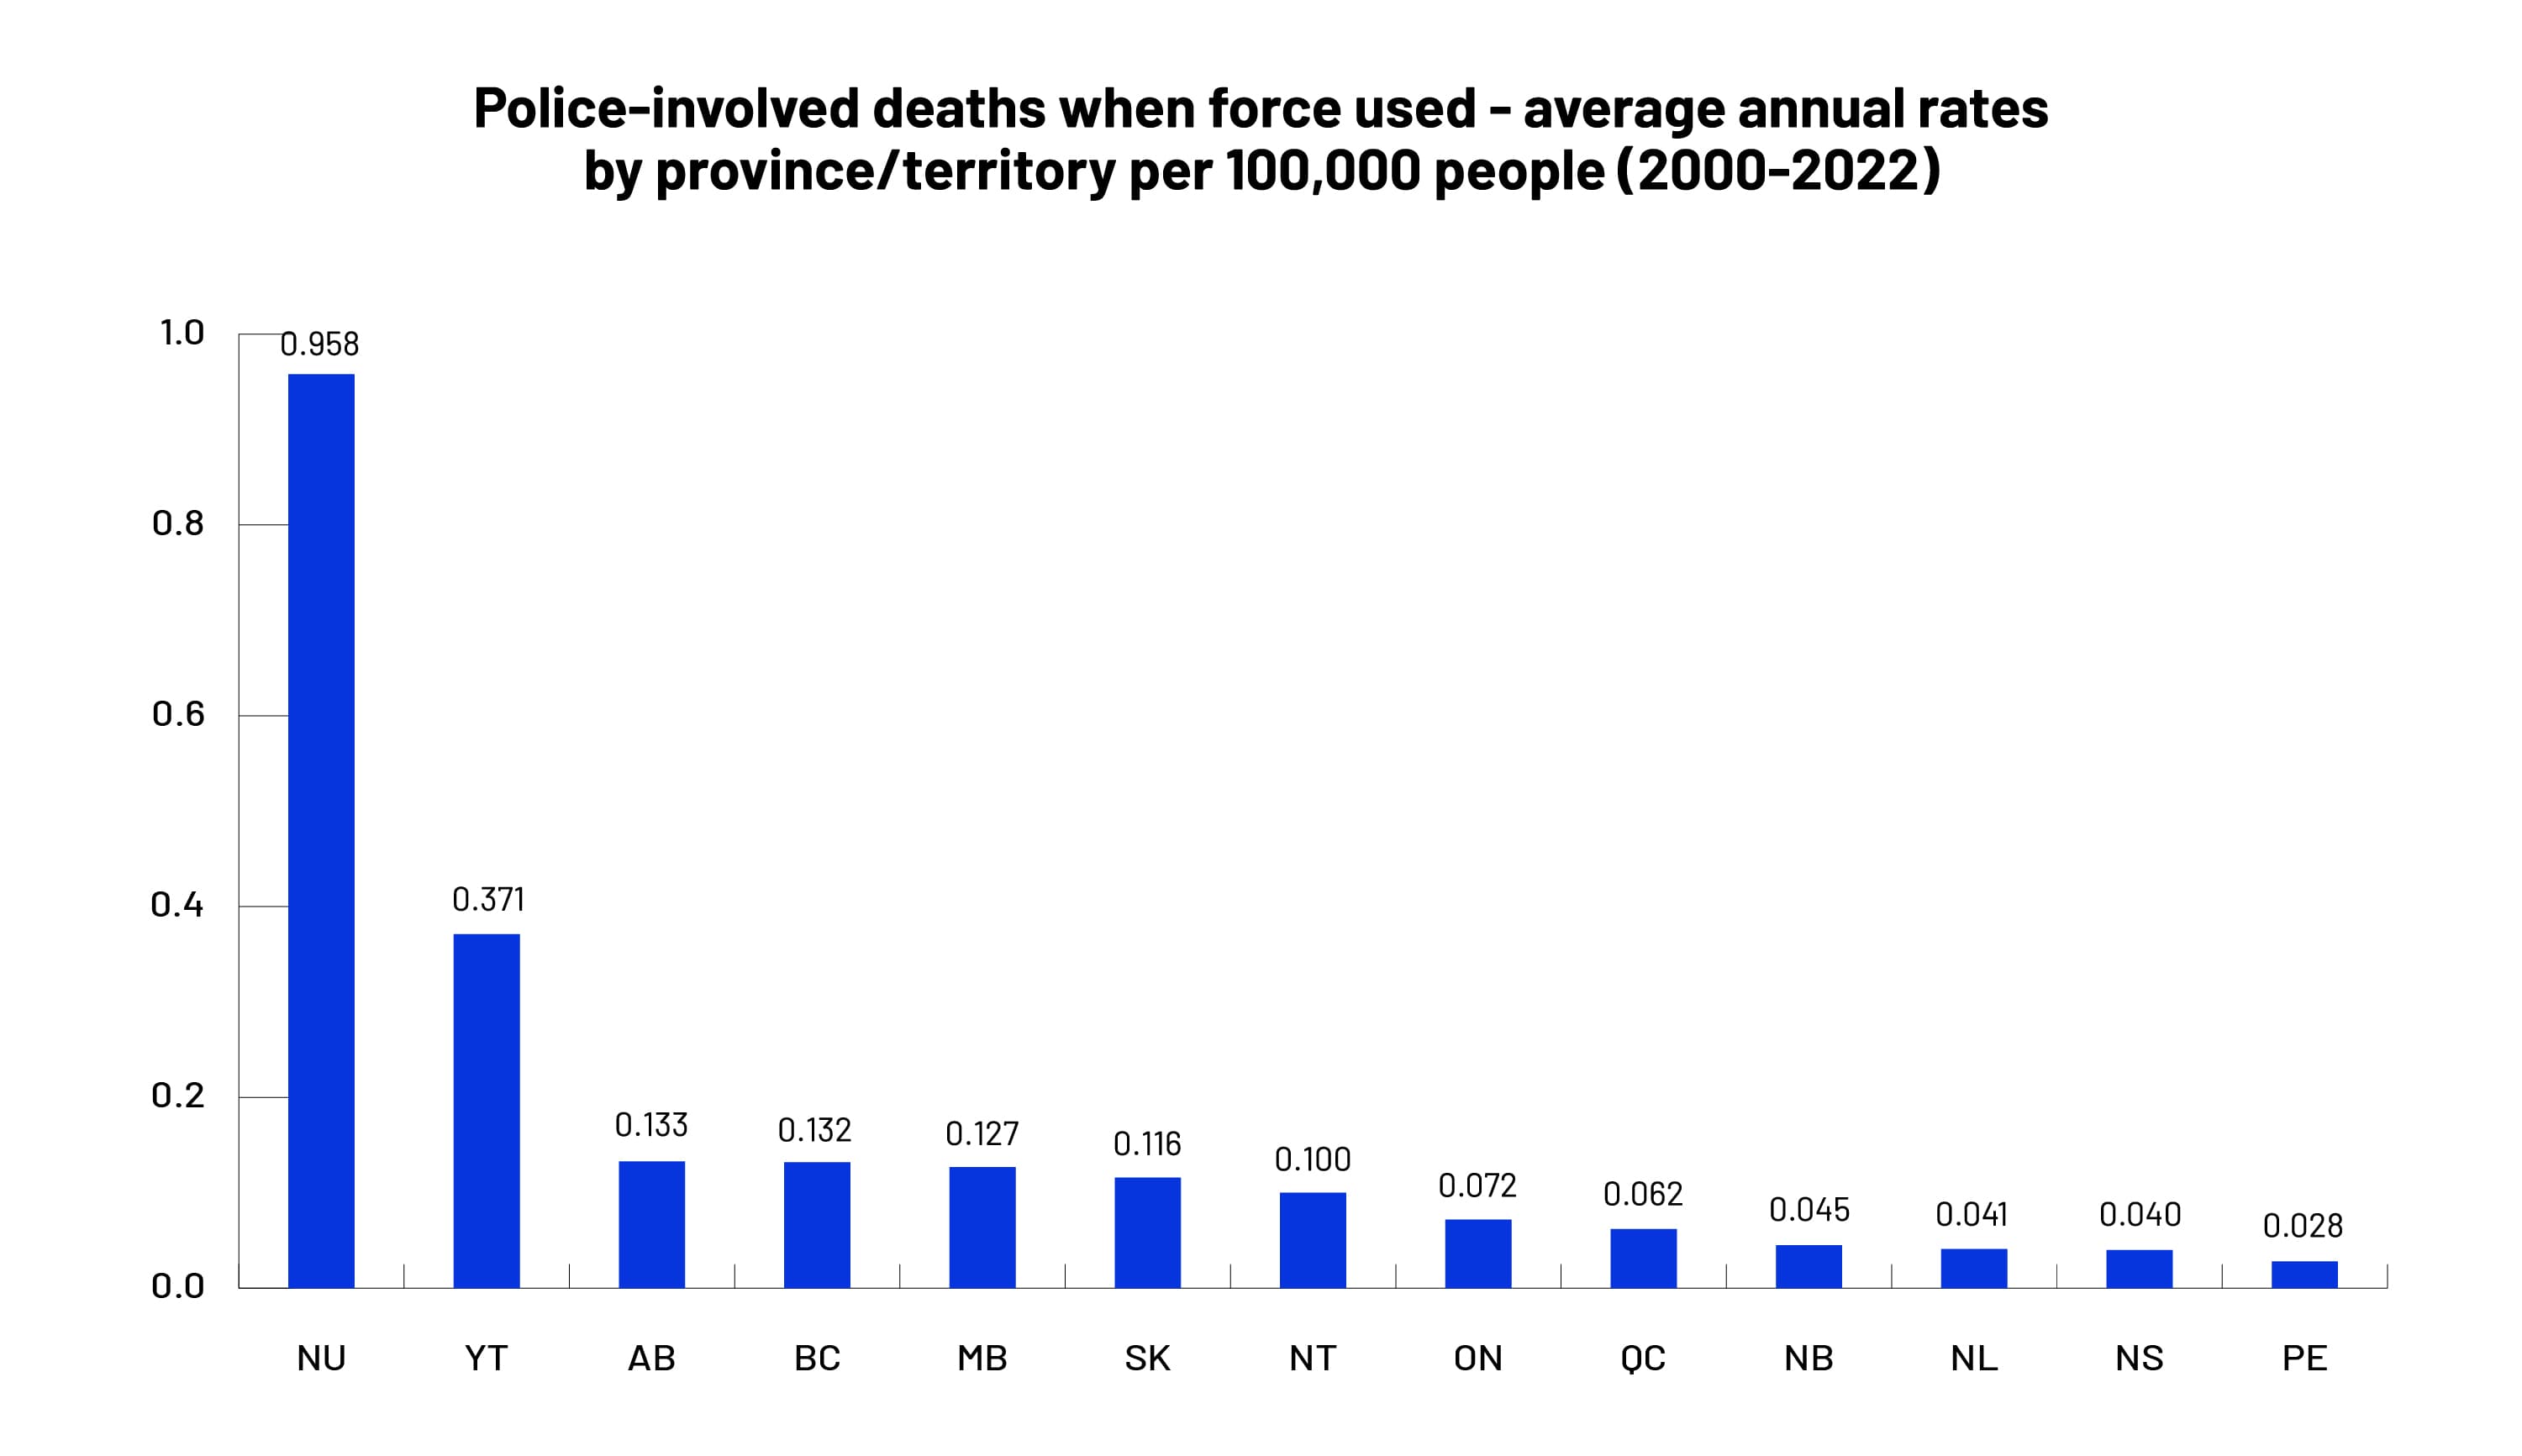
 The average annual deadly force rates per capita are higher in the northern territories and the western provinces, which are all higher than the national annual average of 0.087 deaths per 100,000 people. Nunavut has the most deaths per capita of any province or territory at an average annual rate of 0.958 per 100,000 since 2000.
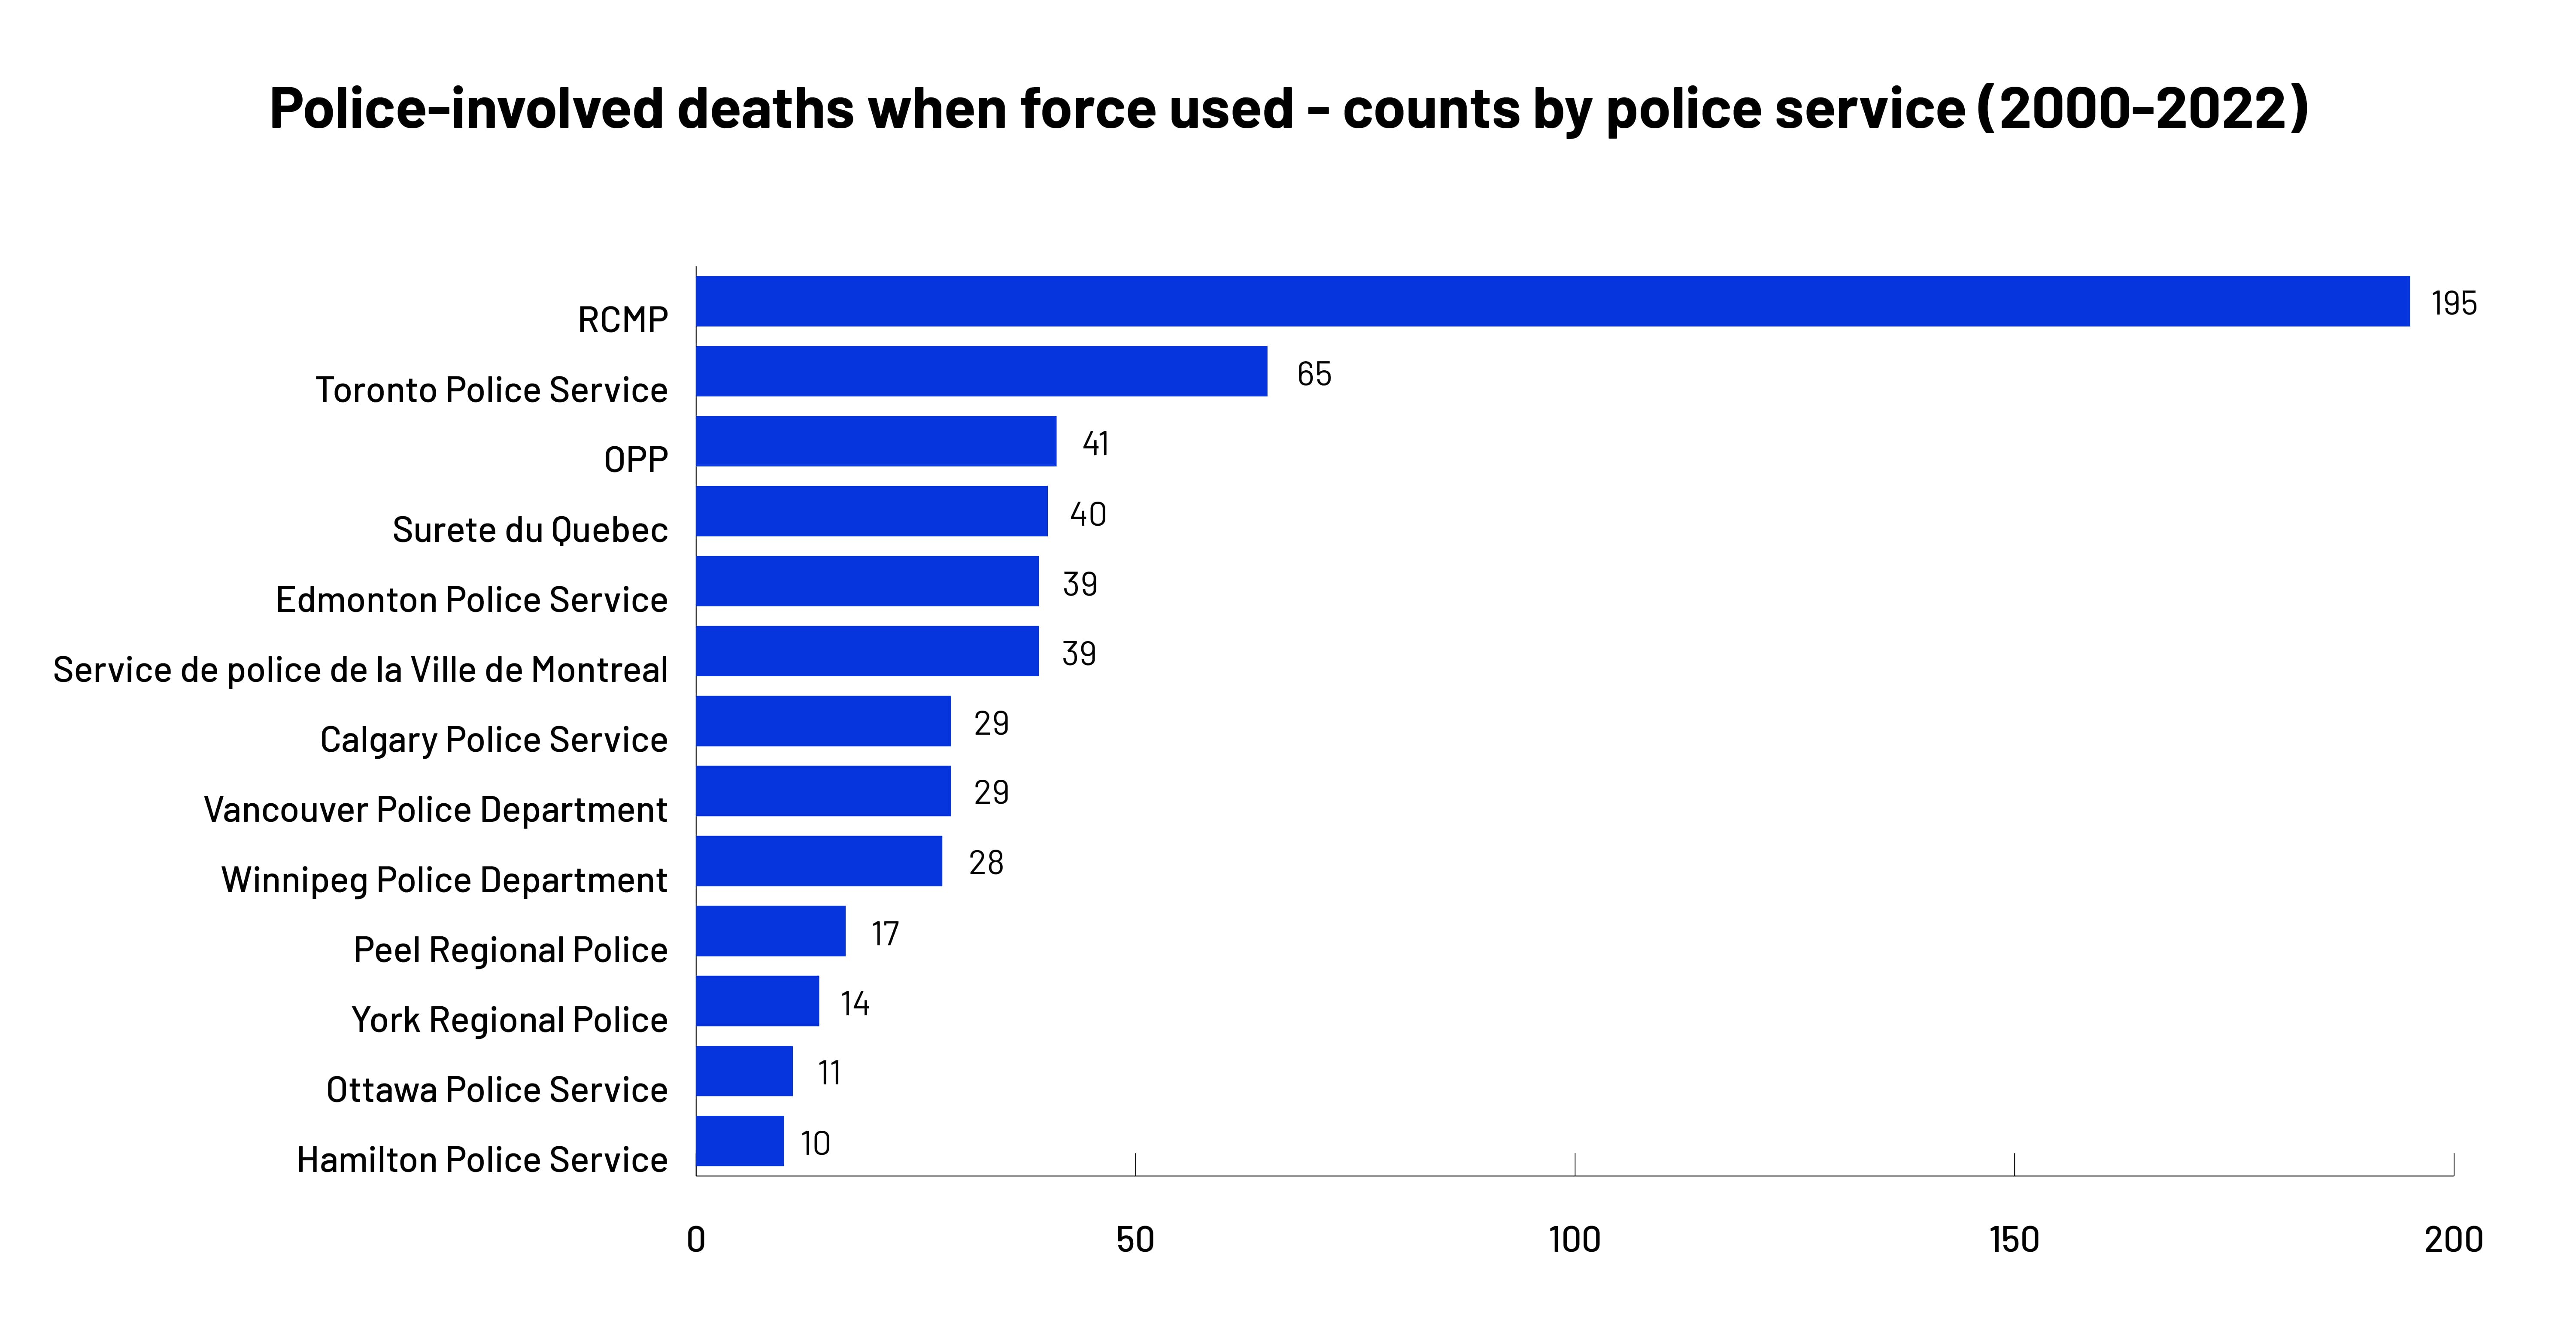
When it comes to police use of force-related deaths, certain police departments are more represented than others. Federal (Royal Canadian Mounted Police) and provincial (Ontario Provincial Police; Surete du Quebec) police forces are implicated in a large number of deaths (n=276). Although federal and provincial police forces are responsible for policing larger amounts of territory, they may not necessarily be responsible for policing larger population numbers. At the municipal level, the Toronto Police Service is implicated in the greatest number of deaths (n=65). Of particular note is the Edmonton Police Service (EPS); despite ranking as Canada’s fifth largest municipality by population according to the 2021 census, the EPS is ranked second behind Toronto (n=39), tied with the Service de police de la Ville de Montreal (SPVM). Further, the Vancouver Police Department is responsible for policing the 8th largest municipality in Canada in terms of population (n= 662,248), yet is implicated in 29 deaths between 2000-2022, tied (with Calgary) for the 4th largest number of deaths by municipality.
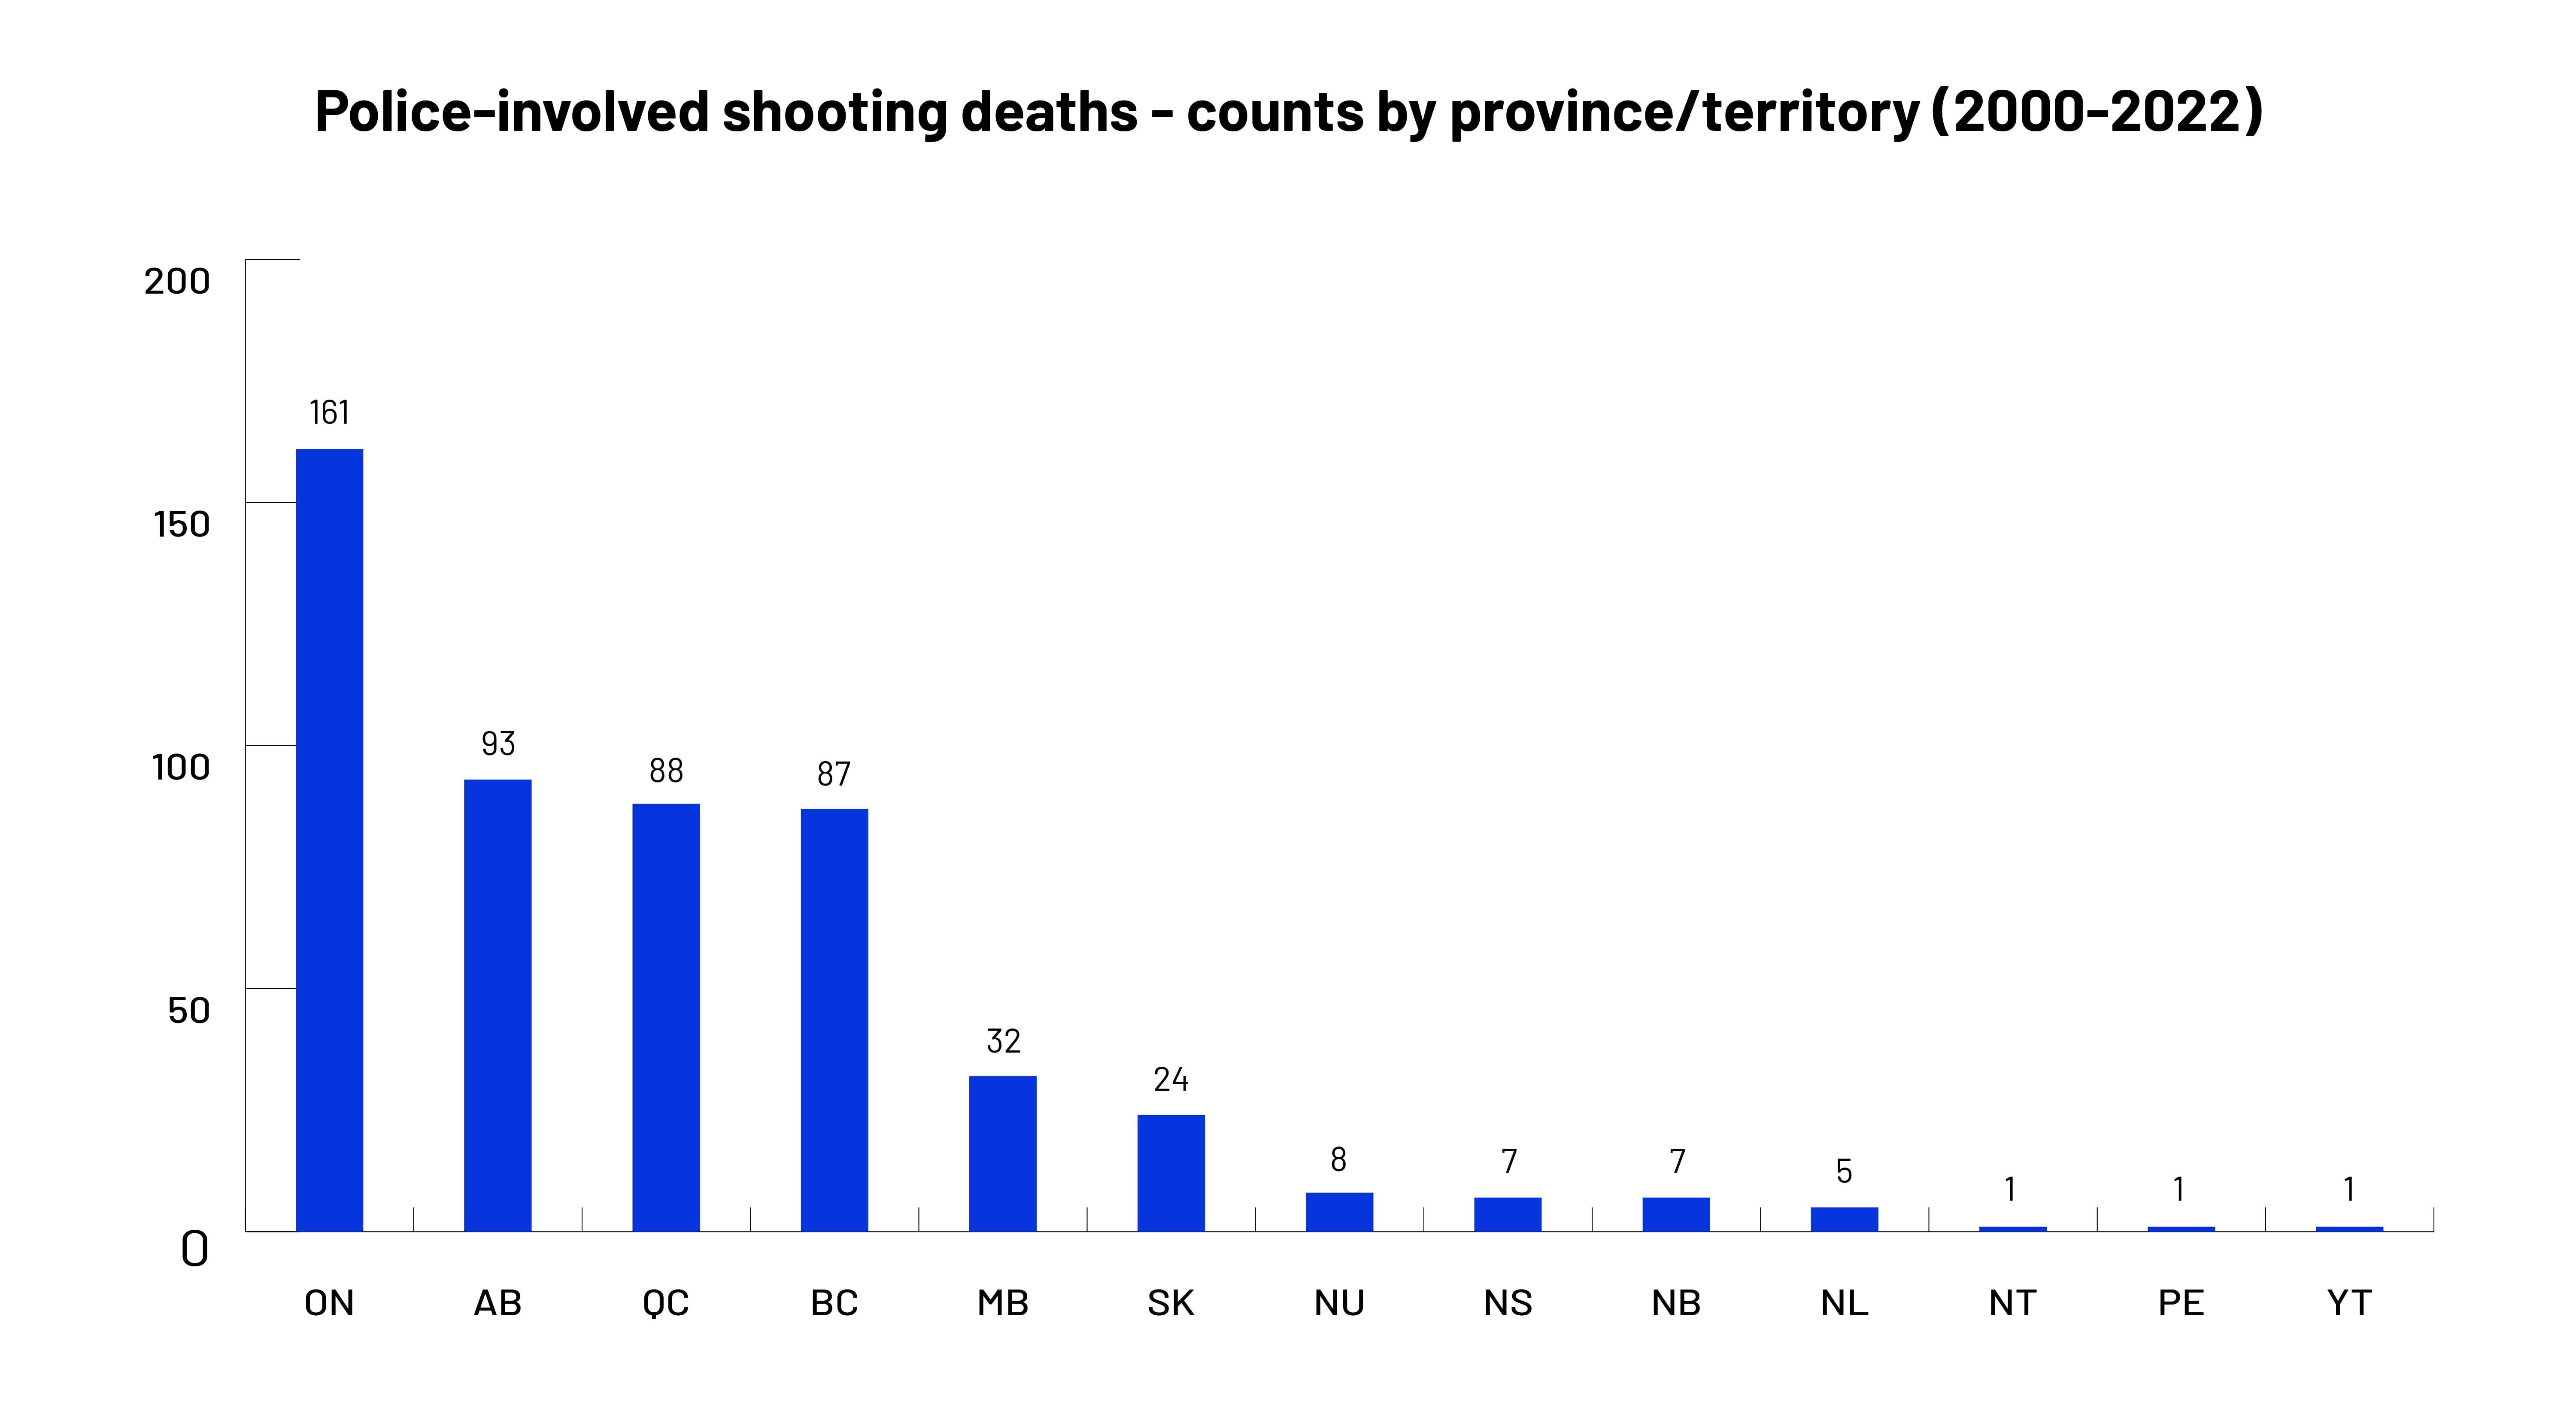
 One of the main contributors to the rise in police-involved deaths has been a notable increase in the number of people shot by a firearm during interactions with police. Much of this increase has been driven by the number of people killed in connection with police shootings in Ontario, Alberta, Quebec, and British Columbia. Taking into account per capita population, however, Alberta has experienced the second highest number of shooting deaths despite having the fourth largest population in the country. Also notable is Nunavut with the lowest population yet seventh highest number of shooting deaths.
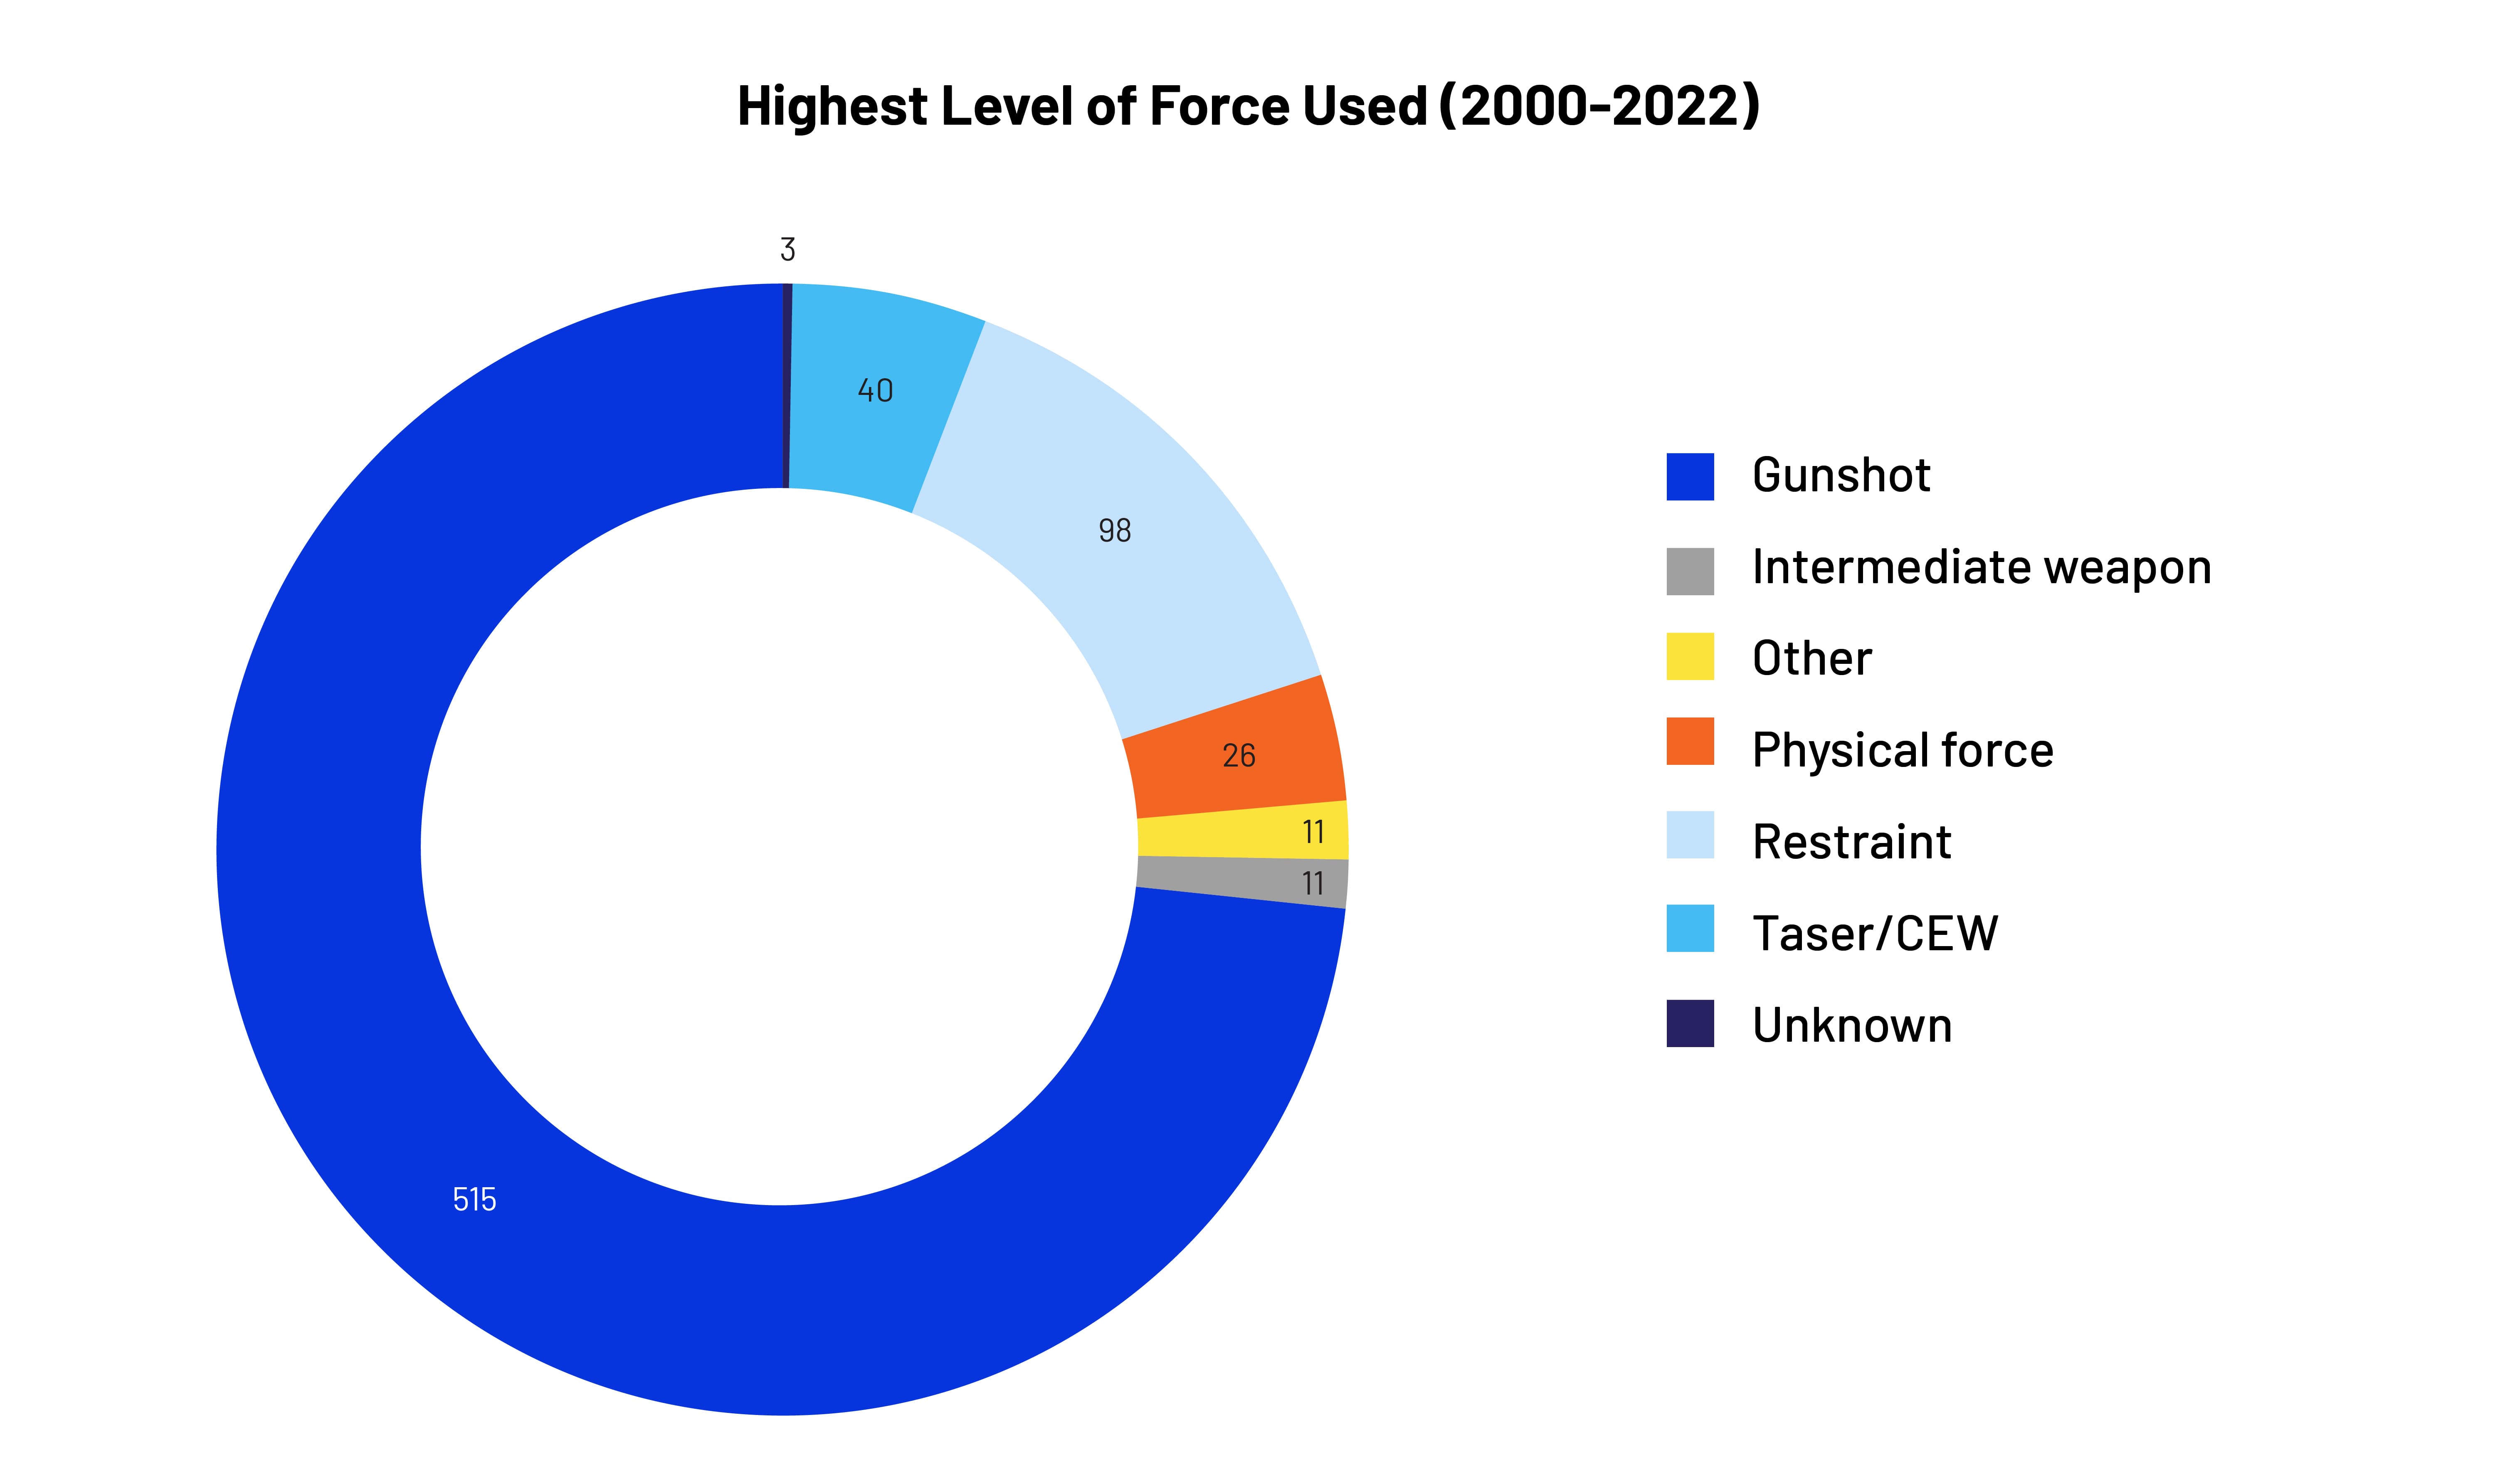
The data also reveal that the vast majority of people were shot by a firearm during interactions with police. Shooting-related deaths account for 73 percent of all police-involved use of force deaths since the year 2000 across Canada.
To learn more about our methods click here. To learn more about our ongoing project click here. Check out the data.